2 PASS Survey Design and Methodology
Contact authors: Beste, Jonas; Collischon, Matthias; Müller, Marcel; Prospero, Valentina; Trappmann, Mark; Fehn, Anja.
This chapter outlines the methodological framework of PASS, focusing on its design principles, data collection strategies, and adaptive developments that ensure representativeness and data quality across survey waves.
Section 2.1 describes the sampling design, including the dual-frame structure combining Unemployment Benefit II (UB II)2 recipients and the general population, as well as the procedures for sample refreshment, replenishment, and inclusion of refugee sub-samples. Section 2.2 explains the mixed-mode data collection approach, which integrates computer-assisted telephone and personal interviews (CATI and CAPI) and details interviewer training, multilingual implementation, and mode-switching protocols. Section 2.3 outlines the respondent incentive strategy, tracing the transition from lottery-based to prepaid monetary incentives and recent adaptive adjustments based on response propensities. Section 2.4 discusses the use of call records, fieldwork monitoring, and the development of responsive and adaptive survey designs, including applications of machine learning to improve participation and reduce bias. This chapter further continues into the next Chapter 3 to discuss yet another important concept of PASS survey design and methodology i.e., Weighting.
These sections present a comprehensive view of how PASS combines robust sampling, flexible fieldwork methods, and adaptive design principles to maintain high data quality and longitudinal consistency.
2.1 Sampling Procedure
The sampling design of PASS is characterized by two key features: a dual-frame approach comprising the Unemployment Benefit II (UB II) recipients and the general population; and an annual refreshment sample of new UB II recipients entering the population.
A comparison between benefit recipients and the general population is essential for analysing inflows into UB II, identifying differences between benefit-recipient and non-recipient households, investigating hidden poverty, and forming control groups. To facilitate such analyses, PASS combines a sample of UB II recipient households with a general population sample.
To capture inflows into UB II at an early stage and to ensure the representativeness of the benefit-recipient sample in cross-sectional analyses, a refreshment sample is drawn for this group in every wave (for details on the refreshment sample concept, see Trappmann et al. (2009), p.11).
2.1.1 Sampling Design in the First Wave
In wave 1, the sample consisted of two distinct sub-samples. They were connected at the first sampling stage through the selection of identical primary sampling units (PSUs) (for further details, see Rudolph & Trappmann (2007), p. 65). Within each PSU, the two subsamples were drawn independently.
Welfare recipient/ UB II sub-sample (UB II recipients):
A random sample of benefit units (“Bedarfsgemeinschaften”) comprising at least one individual receiving UB II in July 2006. The sample was drawn from administrative records provided by the Federal Employment Agency (BA). Since PASS is a household survey, the entire household in which a benefit recipient resided was included in the survey.
General population sub-sample:
This sub-sample consisted of private households in Germany. In wave 1, a random sample of addresses was drawn from the MOSAIC database held by the commercial provider Microm. The sample was disproportionately stratified by status to ensure that households with a lower socio-economic status, and therefore a higher risk of UB II entry, had an increased probability of being included (for results on stratification, see Rudolph & Trappmann (2007)).
At the first sampling stage, 300 postcode sectors were randomly drawn from the postcode register. These postcodes served as PSUs for PASS (for details on PSU selection, see Rudolph & Trappmann (2007), p. 77). The selection probability of each postcode was proportional to the number of households in that sector, based on MOSAIC data. Within each sampling point, benefit units (UB II recipient sample) or addresses (general population sample) were randomly selected.
For the UB II recipient sample, the number of benefit units selected depended on the proportion of UB II recipients within the sampling group (i.e., the number of benefit units according to BA administrative data divided by the number of households according to MOSAIC). On average, 100 benefit units per sampling group were included in the gross sample, ensuring a uniform selection probability across the BA sample (Rudolph & Trappmann, 2007, p. 78). All members of households containing benefit units were surveyed, resulting in 6,804 interviews in the first wave.
For the general population sample, 100 addresses per sampling point were randomly selected. To over-represent lower-status households, addresses from lower-status groups were given a higher probability of inclusion. Field institute staff visited the selected addresses and manually recorded names from doorbell panels. At the institute, a random selection of names was then conducted, ensuring that each selected individual’s entire household was surveyed. This process resulted in 5,990 completed household interviews in the first wave.
2.1.2 Panel Retention and Sample Refreshment
All households participating in a certain wave were targeted for an interview in the next wave if they provided panel consent. Additionally, split-off households (households that separated from originally sampled households) were followed and re-interviewed in subsequent waves. Each split-off household was assigned to the same sub-sample category as its origin household (either from wave 1 or from a refreshment sample in a later wave).
Starting with wave 2, a refreshment sample of newly entered UB II benefit units was added to the study in each wave. These refreshment samples consisted of households that received UB II at the reference date for sampling (i.e. July of the year before the survey wave, e.g. July 2007 for wave 2, up to July 2022 for wave 17) but were not recipients at any earlier sampling dates. The refreshment samples were drawn within the PSUs selected in wave 1, using the same procedure as the original sampling. On average, 1,000 newly interviewed households were added per wave. The cumulative sample of all BA households still receiving benefits at the most recent reference date can be projected to represent all households with at least one UB II recipient in Germany at that time.
2.1.3 Replenishment Samples
As is common in panel studies, attrition occurs over time, reducing the number of households and individuals available for analysis. To mitigate this effect, PASS introduced additional replenishment samples for both sub-samples before wave 5. These replenishment samples differ from the annual refreshment samples, which capture new UB II entrants. Instead, replenishment samples counteract panel attrition by adding new households to maintain representativeness.
For this purpose, 100 new PSUs were selected using probability proportional to size. Unlike previous samples, the wave 5 general population replenishment sample was drawn from municipal registers instead of the MOSAIC database and without stratification. Further details on this procedure are described in Berg et al. (2013), Chapter 6.
Additional general population replenishment samples were introduced in wave 11 and wave 17/18. Due to incomplete processing of cases in wave 17, the non-contacted cases were carried forward as new cases in the gross sample of wave 18. While the wave 11 replenishment was drawn from the existing 400 PSUs, wave 17 introduced an additional 100 PSUs (Berg et al., 2022). Since these new PSUs were independently sampled, some were drawn twice, leading to a total count slightly below 500 PSUs.
Replenishment samples were also drawn for the UB II recipient sample, introduced alongside general population replenishment samples in wave 5 and wave 11. Additionally, a UB II recipient replenishment sample is planned for wave 19, covering new PSUs introduced in wave 17/18.
2.1.4 Refugee Sub-samples
To account for the increasing influx of refugees into SGB II, separate sub-samples for new SGB II entrants from Syria and Iraq were introduced in wave 10 (survey year 2016). Starting with wave 17 (survey year 2023), a separate group was added for Ukrainian refugees entering SGB II.
To ensure sufficient longitudinal case numbers for detailed analyses, replenishment samples were drawn for these refugee groups. The Syrian and Iraqi refugee replenishments were conducted in waves 14 and 15, while wave 19 replenishment samples will cover both refugee groups within the new 100 PSUs from wave 17. Additionally, these refugee-specific samples were disproportionately selected in selected waves to ensure adequate case numbers (see specific data reports for details).
2.1.5 Sub-samples
In the PASS dataset all sub-samples can be identified by the variable sample in the household dataset (HHENDDAT). These wave-specific values are tabulated below.
This table lists PASS variable samples in HHENDDAT by wave, including recipient samples, general population samples, refreshment samples, and replenishment samples.| No. | Wave | Variable sample in HHENDDAT |
|---|---|---|
| 1 | Wave 1 | UB II recipient sample |
| 2 | Wave 1 | General population sample (Microm addresses) |
| 3 | Wave 2 | Refreshment of UB II recipient sample (new entries) |
| 4 | Wave 3 | Refreshment of UB II recipient sample (new entries) |
| 5 | Wave 4 | Refreshment of UB II recipient sample (new entries) |
| 6 | Wave 5 | General population replenishment (municipal registers) |
| 7 | Wave 5 | Replenishment of UB II recipient sample (municipal registers) |
| 8 | Wave 5 | Refreshment of UB II recipient sample (new entries) |
| 9 | Wave 6 | Refreshment of UB II recipient sample (new entries) |
| 10 | Wave 7 | Refreshment of UB II recipient sample (new entries) |
| 11 | Wave 8 | Refreshment of UB II recipient sample (new entries) |
| 12 | Wave 9 | Refreshment of UB II recipient sample (new entries) |
| 13 | Wave 10 | Refreshment of UB II recipient sample (new entries) |
| 14 | Wave 10 | Refreshment of UB II recipient sample (Syrian/Iraqi households) |
| 15 | Wave 11 | General population replenishment (municipal registers) |
| 16 | Wave 11 | Refreshment of UB II recipient sample (new entries) |
| 17 | Wave 11 | Refreshment of UB II recipient sample (Syrian/Iraqi households) |
| 18 | Wave 12 | Refreshment of UB II recipient sample (new entries) |
| 19 | Wave 12 | Refreshment of UB II recipient sample (Syrian/Iraqi households) |
| 20 | Wave 13 | Refreshment of UB II recipient sample (new entries) |
| 21 | Wave 13 | Refreshment of UB II recipient sample (Syrian/Iraqi households) |
| 22 | Wave 14 | Refreshment of UB II recipient sample (new entries) |
| 23 | Wave 14 | Refreshment of UB II recipient sample (Syrian/Iraqi households) |
| 24 | Wave 14 | Replenishment of UB II recipient sample (Syrian/Iraqi households) |
| 25 | Wave 15 | Refreshment of UB II recipient sample (new entries) |
| 26 | Wave 15 | Refreshment of UB II recipient sample (Syrian/Iraqi households) |
| 27 | Wave 15 | Replenishment of UB II recipient sample (Syrian/Iraqi households) |
| 28 | Wave 16 | Refreshment of UB II recipient sample (new entries) |
| 29 | Wave 16 | Refreshment of UB II recipient sample (Syrian/Iraqi households) |
| 30 | Wave 17 | General population replenishment (municipal registers) |
| 31 | Wave 17 | Refreshment of UB II recipient sample (new entries) |
| 32 | Wave 17 | Refreshment of UB II recipient sample (Syrian/Iraqi households) |
| 33 | Wave 17 | Refreshment of UB II recipient sample (Ukrainian households) |
| 34 | Wave 18 | Refreshment of UB II recipient sample (new entries) |
| 35 | Wave 18 | Refreshment of UB II recipient sample (Syrian/Iraqi households) |
| 36 | Wave 18 | Refreshment of UB II recipient sample (Ukrainian households) |
| 37 | Wave 17/2 | General population replenishment (municipal registers) |
2.1.6 Sampling Frame and Auxiliary Data for Non-response Analyses and Post-Survey Adjustments
In addition to the survey design measures implemented to minimise non-response and panel attrition, PASS benefits from a comprehensive database that allows for detailed non-response analyses and post-survey adjustments.
The population samples were either drawn directly from the MOSAIC database by Microm Consumer Marketing in wave 1 or subsequently linked to it using address information in wave 5. The MOSAIC database provides auxiliary variables at the address level that can be used, for example, to predict survey non-cooperation based on indicators of social status or privacy concerns, or to assess the likelihood of successfully locating and contacting a sampled unit using information such as the proportion of households moving away from a given area within a year (Sinibaldi et al., 2014). These auxiliary variables were incorporated into the post-survey adjustments for the wave 1 population sample. A more detailed description of the MOSAIC database is provided by Kueppers (2005).
In addition to the auxiliary data from MOSAIC, the administrative record data on benefit receipt, used for drawing the register samples, provides an even more detailed dataset. These administrative records contain individual-level information, including educational attainment, age, and current employment status, which can be used to analyse and adjust for initial non-response in the UB II recipient sample.
This rich data source ensures that non-response analyses and post-survey weighting adjustments can be conducted with a high level of precision, improving the overall representativeness and reliability of the PASS dataset.
2.2 Mixed-Mode Design
PASS employs a mixed-mode design that combines computer-assisted telephone interviewing (CATI) and computer-assisted personal interviewing (CAPI). In waves 1-3, CATI served as the default mode. This sequential mixed-mode design was adopted as a cost-effective approach to address challenges typically encountered when surveying low-income and welfare populations (Rudolph & Trappmann, 2007, pp. 91–92). These challenges include respondents’ higher mobility compared with the general population, contacting difficulties due to limited landline coverage or frequent changes in mobile phone numbers and extremely low expected response rates in self-administered survey modes.
The sequential structure ensures that respondents who cannot be contacted or interviewed by telephone are subsequently visited in person for a CAPI interview. Following a tender process, the fieldwork agency responsible for data collection and preparation changed after wave 3 (A. Müller et al., 2011). This transition also marked a shift towards using CAPI as the default mode for all refreshment samples from wave 4 onwards.
In waves 1-3, interviewers first attempted to contact households by telephone whenever a valid number was available for the address, either through the sampling frame or through tracing prior to fieldwork. Households without a valid number were initially assigned to CAPI mode. From wave 4 onwards, CAPI became the default for refreshment samples, while panel households were first approached in the mode used during their previous interview. Across all waves, a mode switch from CATI to CAPI occurred if telephone contact attempts failed or if a household requested a face-to-face interview. Conversely, cases were switched from CAPI to CATI if personal contact attempts were unsuccessful or upon the household’s request for a telephone interview.
Contact attempts in both modes were distributed across different weekdays and times of day to minimise non-response due to non contact. Further details on the organisation of fieldwork for each wave can be found in the respective field reports (e.g. Jesske et al. (2024), for wave 17).
In waves 1-3, interview mode was assigned at the household level, meaning that all members were interviewed using the same mode. From wave 4 onwards, mode assignment became more flexible and could be determined at the individual level.
Refusal conversion attempts were also conducted by telephone towards the end of each fieldwork period. These targeted households or individuals who initially refused to participate due to reasons such as lack of time, lack of interest, or abrupt call termination. Specially trained CATI interviewers with above-average performance during regular fieldwork handled these cases (see Hartmann et al. (2008), p. 54-56 for waves 1-3; Jesske et al. (2024), p. 61 for wave 17). Indicator variables for interview mode are available in the PASS Scientific Use File to control for potential mode effects in empirical analyses.
Mode effects have been investigated in several articles, most comprehensively by Sakshaug et al. (2023) .
Given that a substantial proportion of the target population has a migration background, many respondents have limited proficiency in German. To ensure inclusivity, the questionnaire was translated into Turkish, Russian, Ukrainian, and Arabic which are the most common first languages among immigrants in Germany (see FDZ-Datenreport 7/2024 : Berg, Cramer, Dickmann, Gilberg, et al. (2024)).
Since PASS relies on telephone and in-person interviews, it requires a large pool of trained interviewers. Before conducting interviews, all interviewers undergo training tailored to their level of experience with or new interventions within the study. The content and structure of these training sessions are detailed in the data reports associated with the respective waves.
The figure below summarises the overall administration switch of PASS survey.
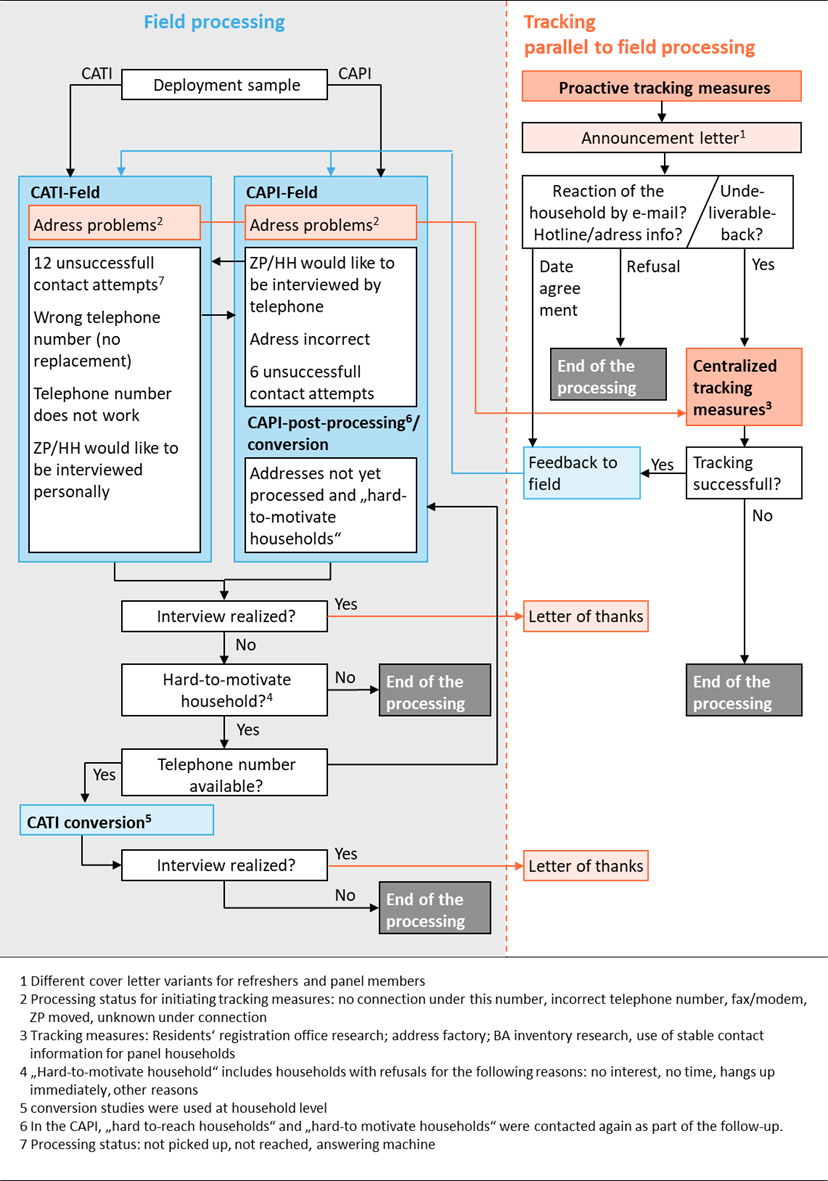
Figure 2.1: (Sequential) Mixed mode switch survey administration of PASS
2.3 Respondent Incentives
In line with practices in other large-scale household surveys, PASS provides respondent incentives to improve participation rates and minimise non-response and attrition bias.
In wave 1, all sampled households received a special postage stamp as a small token of appreciation, included with the advance letter. The letter informed recipients that they would receive a lottery ticket for “Aktion Mensch” after completing the interview. Each respondent was subsequently sent a thank-you letter along with the ticket, valued at approximately 1.50 EUR.
In wave 2, the incentive strategy remained largely unchanged, except that the lottery ticket was now for the “ARD-Fernsehlotterie” and its value increased to around 5.00 EUR. Alongside extended fieldwork periods and intensified tracking efforts, wave 3 introduced a major change: a shift from conditional to unconditional monetary incentives as an effort to improve survey participation. Each household received a prepaid 10.00 EUR banknote with the advance letter, regardless of eventual participation. This prepaid incentive was provided to all panel households that had participated in the previous wave.
To evaluate the effects of this change on response rates, sample composition, and bias, a split-sample experiment was implemented (Felderer et al., 2018). Households (new participants) from the wave 3 refreshment sample were excluded from this experiment and continued to receive the conditional incentive i.e., a lottery ticket sent after participation for each respondent (Büngeler et al., 2010, pp. 18–20).
Between waves 4 and 6, the monetary incentive approach was maintained and extended in two ways. First, panel households received the unconditional 10.00 EUR incentive, but now at the individual level, meaning each household member eligible for interview received the amount. The prepaid incentive served a dual purpose: to foster respondents’ commitment to the study and to increase their motivation to participate.
From wave 17 onwards, the prepaid incentive amount began to vary according to predicted participation probability (Beste et al., 2023). The threshold for participation was defined as 50 per cent of the panel households. The model used data on prior participation behaviour to classify households into two groups:
- Individuals from high-propensity households (likely to participate) received a prepaid 10.00 EUR incentive with an advance letter.
- Individuals from low-propensity households (less likely to participate) received an augmented payment of 20.00 EUR with an advance letter.
Household members who did not participate in the previous wave received neither an advance letter nor a prepaid incentive. Consequently, within some households, where not all individuals aged 15 and over could be surveyed in the preceding wave, it was possible that certain members received 10.00 EUR or 20.00 EUR in advance, while others received none. Since wave 17, prepaid incentives have also been utilised to address temporary non-response due to lack of time or soft refusals (Jesske et al., 2024, pp. 57–59).
As a secondary extension, certain cases from refreshment-sample respondents began receiving the same monetary incentive and a thank-you letter; after completing their interview i.e., conditional on response (Jesske & Quandt, 2011, pp. 31–32). The following categories of first-time interviewees are included in PASS: Respondents returning after a temporary drop-out due to unavailability, Members of split households not interviewed in the previous wave, and First-time participants in the refreshment samples.
Since wave 17, the post-interview incentive for these first-time respondents from the refreshment sample(s) was raised to 20.00 EUR per individual, to encourage participation among new entrants (Jesske et al., 2024, pp. 59–60).
Across all waves, face-to-face interviewers were additionally equipped with “doorstep incentives” alongside the incentives distributed centrally by mail, to encourage cooperation during household visits. Interviewers could offer small tokens of appreciation such as flowers, chocolates, or similar gifts, at their discretion. The standard guideline allowed 2.00 EUR per panel household and 5.00 EUR per refreshment household. Interviewers could either provide individual gifts or pool funds to purchase a larger token of appreciation for the household. Although this practice was used sparingly, it was recognised as a helpful strategy for fostering positive engagement during fieldwork (Jesske et al., 2024, p. 60).
2.4 Call Records, Fieldwork Monitoring, and the Development towards an Adaptive Design
Survey agencies routinely collect call history data including the date, time, and outcome of each contact attempt to monitor and improve data collection quality.
In interviewer-led surveys such as PASS, which combine face-to-face (CAPI) and telephone (CATI) modes, a “call” refers to either a household visit or a phone contact attempt. Call records play a central role in implementing responsive and adaptive survey designs (see Groves & Heeringa (2006); Laflamme et al. (2008)) by helping identify hard-to-reach or reluctant participants and guiding follow-up strategies. They also inform interviewer training, field supervision, and performance evaluation.
A major advantage of call data is that it is collected for both respondents and non-respondents. When combined with sampling frame information and auxiliary data, (often referred to as survey process data or “para data”) (Couper, 1998; Kreuter, 2013), these records enhance the modelling and correction of non-response bias. Furthermore, call record data and other paradata have extensively been used to investigate PASS survey data quality, in particular measurement error bias and non-response bias(e.g., Kreuter et al., 2010, 2014; West et al., 2014)
This section initially outlines the development of field monitoring in PASS, followed by a discussion of its transition towards adaptive survey design.
Since wave 1, detailed call records have been available in PASS. These include the sample member identifier, date and time of each contact, call outcome, survey mode, and indicators showing whether the call was part of a refusal conversion effort or the foreign-language fieldwork. From wave 4 onwards, individual-level call data became available for both telephone and face-to-face interviews.
Initially, call data were used to monitor key fieldwork metrics such as contact and cooperation rates, numbers of fixed and vague appointments, and cases requiring tracking. From wave 4, these data were linked to sampling frame variables to assess and reduce non-response bias during ongoing fieldwork. By wave 5, PASS had introduced response propensity models and R-indicators (Schouten et al., 2009) for real-time bias monitoring within fieldwork.
Since wave 6, the core field monitoring system Trappmann & Müller (2014) has remained stable. In addition to weekly tabular reports from the survey agency, internal graphical analyses have been produced using call data. These visualise field progress through four key indicators at the household level i.e., contact rate, proportion of appointment address issues/ changes, cooperation rate, and response rate of successfully conducted interviews at the household level (panel households and the new sample households of the current wave). To evaluate fieldwork progress, wave-to-wave comparisons are also conducted. Complementary graphs display the share of completed person interviews within households.
Around ten weeks into fieldwork (and for the foreign language field, around week 8/9), once all sample groups are in the field, R-indicators and bias analyses are produced. R-indicators, measuring contact and household interview success, are calculated for panel households and displayed as part of the field progress dashboard3. The accompanying bias analysis examines the distribution of key demographic variables such as age, education, gender, nationality, family status, and household type (e.g. single parent, couple with or without children), across panel households.
In wave 6, PASS first used call data to prioritise likely non-respondents and introduced enhanced interviewer incentives to mitigate bias. This wave also marked the initial effort to optimise call scheduling based on call history, aiming to reduce effort while improving contact and cooperation rates (Trappmann & Müller, 2014). These initiatives represented the first steps towards an adaptive survey design in PASS.
By wave 14, the design had evolved further. Beste et al. (2023) tested a machine learning-based adaptive approach, training models on past panel data to predict response propensities. The model identified households at higher risk of attrition, which were then prioritised during fieldwork. Increasing prepaid incentives from €10 to €20 for these high-risk cases led to a measurable reduction in drop-out rates and non-response bias.
For an overview of field monitoring indicators across major German social surveys, see Fieldwork Monitoring in Practice: Insights from 17 Large-scale Social Science Surveys in Germany (Meitinger et al., 2020). For theoretical perspectives on para data and its role in survey improvement, see Kreuter (2013).
For a deeper understanding of adaptive design, in addition to the publications mentioned above, refer to Chun et al. (2018) where the authors discuss four pillars of responsive and adaptive design (survey process data and auxiliary information, design features and interventions, explicit quality and cost metrics, and a quality-cost optimisation tailored to survey strata). They also highlight challenges in implementation.
Experimental evidence from Zhang & Wagner (2022) further evaluates the impact of adaptive design relative to post-survey adjustments, using data from the Detroit Metro Area Communities Study. Watson & Cernat (2023) compares short- and medium-term effects of fieldwork modifications in two household panels, namely, the Household, Income and Labour Dynamics in Australia (HILDA) Survey and the UK Household Longitudinal Study. Thus, showing that targeting decisions are more effective when made at the household rather than individual level.